
Graphing Honeywell's Evohome
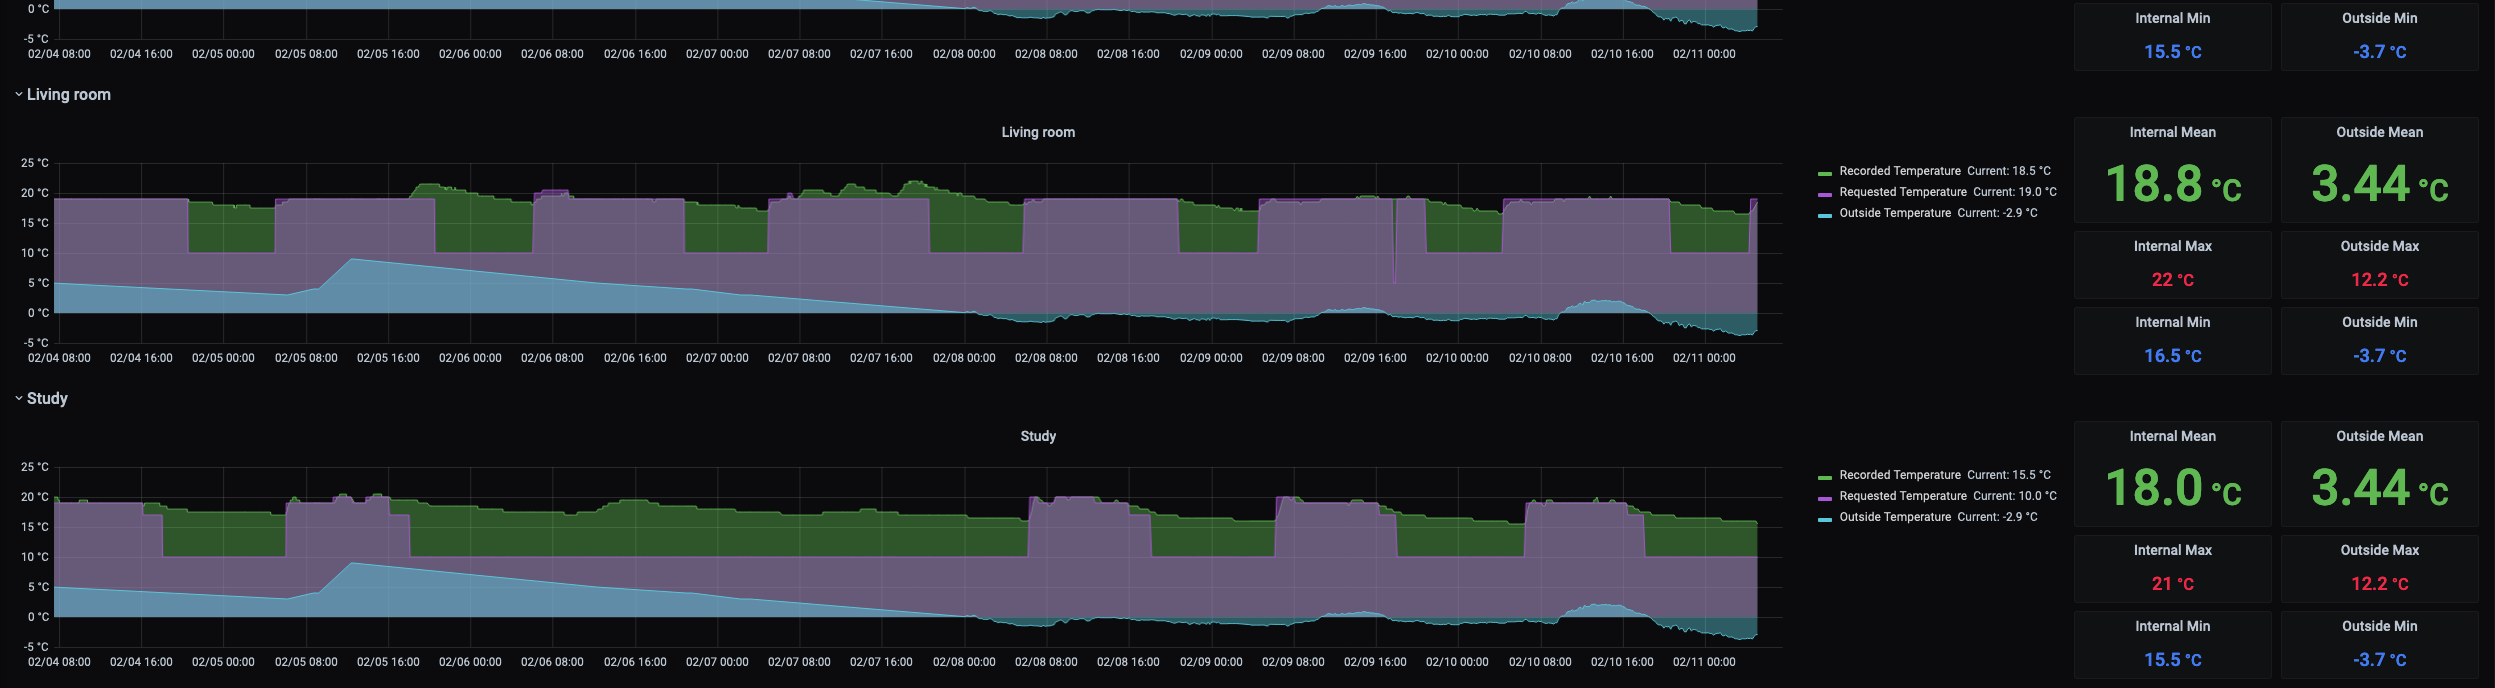
Ever wanted to see the temperature of each room in your house plotted on a graph against the current outside temperature and the temperature you’re requesting from your boiler? No, me neither… but I’ve written a thing to do just that.
This was mostly an experiment to see if a) I can copy/paste enough Python from the internet to make A Thing that works, and b) to see what it is possible to extract from the Honeywell Evohome API. The mini project combines a Granafa, Influxdb and a Python container in a small docker-compose stack. It calls the Evohome API, Openweathermap’s API and integrates with healthchecks.io so you know if/when data stops being collected. The project is designed to be run on a Raspberry pi, but will build and run on a x86/64 machine too.
Prior to this I’d never had a need for Python, some other scripting language always filled whatever automation gap I was trying to fill. I’m very much a learn-by-doing person, preferring to just break stuff until it works rather than to watch hours of YouTube videos.
If you’re still bothering to read this far, be aware that you need a Honeywell Evohome system, and you need to be in Europe. Apparently American Evohome systems use a different API.
I was already aware of a project to write a python module that does a lot of the heavy lifting for this project. They haven’t done an official release in a long time, but they are still maintaining the project, so to start with, I clone their repo into my container and deploy it.
The Python to query the Evohome API was pretty simple, largely a copy/paste job from their readme.
Next in the stack was Influxdb…. Something I’ve been aware of but never used in anger. It’s a time series database… I.e. a database that’s great for storing data values against a time stamp… perfect for this project. All I did was fire up their docker container and start poking about (with a bit of help from Duck Duck Go) to understand how to put data into it. From there it was a case of a bit more searching to work out how to translate that into Python.
Lastly Grafana. I’ve used this for years, and I love that you can configure pretty much every aspect of it through environment variables (or a config file if you prefer). A few taps later and I had a Grafana container that connected itself to my Influxdb data source and had a dashboard all provisioned for it.
This is wrapped up in a docker-compose stack, and there’s an optional line to ping healthchecks.io every time data is collected. If it stops collecting data, then healthchecks.io will let you know (via email, Slack, Pushover… whatever you configure). Healthchecks.io is free for a decent number of checks.
Anyway, I have no real reason to have written all this. If you’ve got this far, well done and thanks for indulging me. If you’d like to look at the project, feel free, you can find it here.